
 Translate
King County greenhouse gas emissions
King County assesses greenhouse gas (GHG) emissions regularly – both for King County government operations and the community. GHGs are the primary cause of recent climate change. This webpage provides data on countywide sources of GHG emissions as well as partnership efforts to assess and reduce regional GHG emissions. Learn more about King County’s actions to reduce GHG emissions in King County’s 2020 Strategic Climate Action Plan (SCAP).
The latest study of countywide greenhouse gas emissions is the clearest call ever for immediate climate action. Thanks to the solid foundation that we have built in our region and state, we are in a strong position to leverage unprecedented federal investments in solutions to the climate crisis and accelerate the transition to a clean energy future. It is our responsibility to the communities we serve, and particularly to the generations who will follow, to do everything we can as soon as we can.
King County Geographic GHG Emissions Inventory and Wedge Report (3.8 Mb)
This report provides a 2019 and 2020 update of the county’s communitywide geographic GHG emissions. The report includes: (1) a progress update of trends and progress toward the County’s GHG emission reduction goals; (2) an analysis that quantifies drivers of changes in emissions; and (3) a wedge analysis that develops scenarios of emissions reduction actions and policies that combined achieve adopted GHG reduction targets.
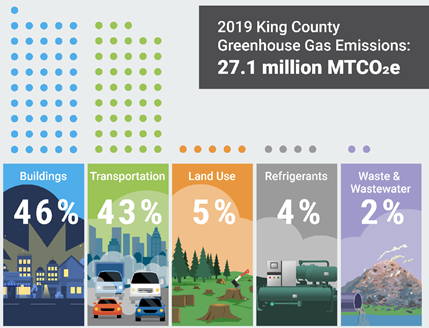
King County Geographic GHG Emissions (2019)
Total countywide geographic GHG emissions sources, showing buildings and transportation as the largest sources. Details provided in the report.
King County Consumption GHG Emissions Inventory and Wedge Report (1.2 Mb)
This report estimates GHG emissions associated with the consumption by all residents of King County. It's equivalent to a personal household carbon footprint estimate, except estimated for all households. Consumption-based emissions are modeled based on local variables such as income and vehicle ownership. These GHG emissions come from the goods and services that are purchased and consumed locally but are produced across the globe.
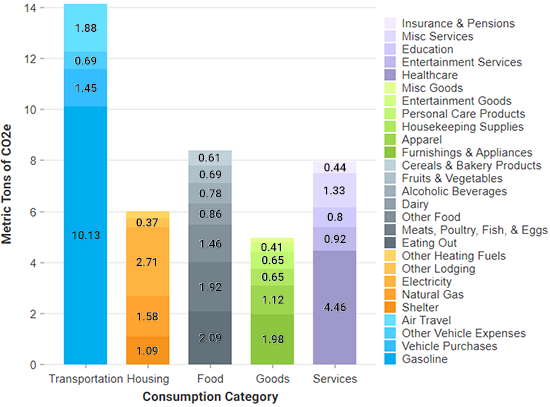
King County Consumption GHG Emissions (2019)
Average emissions per King County household (total 42 MTCO2e), showing transportation and housing as about half of an average household’s footprint, but also that consumption of food (20%), goods (12%) and services (20%) are equally important sources. Details provided in the report.
King County’s most recent communitywide reports provide data for both 2019 and 2020. However, because 2020 marked the beginning of the global COVID-19 pandemic, 2020 is not a focus of the project and 2020 data should not be interpreted as indicators of long-term emissions sources or trends.
Puget Sound Regional Emissions Analysis Project
Completed in 2022, King County led the “Puget Sound Regional Emissions Analysis Project” that provides comprehensive GHG emissions data and innovative tools to advance local climate action for central Puget Sound cities and counties across King, Kitsap, Pierce, and Snohomish counties.
The project was in partnership with the King County-Cities Climate Collaboration (K4C); Kitsap County ; Pierce County ; Puget Sound Clean Air Agency ; Puget Sound Regional Council ; City of Seattle ; and Snohomish County .
Analysis through the project shows that implementing new local, state, and federal energy policies will significantly reduce regional emissions over the coming years and that the region is well positioned for unprecedented investments from the federal and state governments. However, it also shows an urgent need for collective action by local governments, industries, businesses, and residents to cut emissions faster to avoid the worst impacts of climate change and speed transition to an equitable, sustainable economy.
Tools available through the project are provided below. The tools use methodologies, forecasts, and assumptions for geographic emissions as described in the King County Geographic GHG Emissions Inventory and Wedge Report (3.8 Mb) and for consumption emissions as described in the King County Consumption GHG Emissions Inventory and Wedge Report (1.2 Mb).
Tools available through the project include:
- Geographic GHG Emissions Inventory Database (PowerBI database, 630 Kb)
This dashboard and database tool allows users to explore local geographic sources of community GHG emissions for King, Kitsap, Pierce, and Snohomish counties and each of the 39 cities in King County. - Geographic GHG Wedge Planning Tool (3.0 Mb)
This spreadsheet planning tool allows users to explore and customize different scenarios to achieve deep reductions in community geographic GHG emissions for King, Kitsap, Pierce, and Snohomish counties and each of the 39 cities in King County. - Consumption GHG Wedge Planning Tool (4.1 Mb)
This spreadsheet planning tool allows users to explore and customize different scenarios to achieve deep reductions in community consumption GHG emissions for King, Kitsap, Pierce, and Snohomish counties.
Archive of past reports and inventories
2017 Update: GHG Emissions in King County (893 Kb)
2015 Update: GHG Emissions in King County (2.9 Mb)
2010 Update: GHG Emissions in King County (143 Kb)
2008 Update: GHG Emissions in King County (5.8 Mb)
2003 Update: Inventory of King County Air Emissions (434 Kb)